Preamble
Tools: QGIS
Data: Sentinel-2 spectral bands (same dataset as Session 2)
Goal: compute and analyse a vegetation index (NDVI) and perform a simple land cover classification using thresholding.
Learning Objectives
By the end of this session, students will be able to:
Compute a spectral index using the Raster Calculator
Understand the NDVI formula and its interpretation
Analyse the distribution of NDVI values using histograms
Interpret vegetation patterns from NDVI maps
Perform a simple land cover classification using NDVI thresholds
Course Material
We use the same Sentinel-2 dataset as Session 2.
📂 Labworks data
📥 session_1_data.zip
If needed:
Download the dataset
Unzip the archive
Place the folder in a known location on your computer
Tasks
Task 1 – Load the data
Open QGIS and load the spectral bands used previously.
Menu: Layer → Add Layer → Add Raster Layer
Task 2 – Computing NDVI
Vegetation indices exploit the spectral behaviour of vegetation.
Healthy vegetation:
strongly reflects Near Infrared (NIR)
absorbs red light
The Normalized Difference Vegetation Index (NDVI) is defined as:
NDVI = (NIR - Red) / (NIR + Red)
For Sentinel-2:
NIR = B8
Red = B4
Steps
Open the Raster Calculator: Raster → Raster Calculator
Enter the following expression:
(“B8@1” - “B4@1”) / (“B8@1” + “B4@1”)
Set:
Output layer name:
NDVIOutput format: GeoTIFF
Choose a destination folder
Click Run.
Questions
What is the theoretical range of NDVI values?
Which areas show the highest NDVI values?
Task 3 – Visualizing NDVI
Open Layer Properties → Symbology for the NDVI layer.
Select: Singleband pseudocolor
Choose a color ramp such as: Red → Yellow → Green
This visualization better highlights vegetation gradients.
Task 4 – Exploring NDVI values using the histogram
Open:
Layer Properties → Histogram
Display the histogram of the NDVI layer.
Observe the distribution of NDVI values.
Questions
What NDVI values correspond to vegetation?
What NDVI values correspond to water or urban areas?
Is the distribution unimodal or multimodal?
Task 5 – Pixel value inspection
Use the Identify Features tool and click on different land cover types:
forest
crops
water
urban areas
Record the NDVI values.
Questions
Which land cover type has the highest NDVI values?
Which land cover type has negative NDVI values?
Task 6 – NDVI classification using thresholds
NDVI values can be used to perform a simple land cover classification.
The idea is to assign a class number to each pixel depending on its NDVI value.
Each class corresponds to a type of land cover (water, soil, vegetation, etc.).
Step 1 – Open the Raster Calculator
Menu: Raster → Raster Calculator
Step 2 – Classification expression
Enter the following expression:
(“NDVI@1” < 0) * 1 + (“NDVI@1” >= 0 AND “NDVI@1” < 0.2 ) * 2 + (“NDVI@1” >= 0.2 AND “NDVI@1” < 0.5) * 3 + (“NDVI@1” >= 0.5) * 4
Save the output as: NDVI_classes.tif
The same logic is applied to all conditions, and the results are added together to produce the final classification raster. Since only one condition can be true for a pixel, the sum returns the corresponding class.
Output classes
The output raster contains integer class values:
| Value | Meaning |
|---|---|
| 1 | Water / negative NDVI |
| 2 | Bare soil / urban areas |
| 3 | Sparse vegetation |
| 4 | Dense vegetation |
Each pixel in the output image therefore represents a land cover class derived from NDVI thresholds.
Visualization
Open:
Layer Properties → Symbology
Select:
Paletted / Unique values
Assign colors to each class to visualize the classification map.
Questions
How does this simple classification compare with the RGB image?
Which NDVI threshold seems the most sensitive?
What limitations do you observe with this simple thresholding approach?
Task 7 – Cartographic layout
In this task, you will create a cartographic layout to produce a map of the NDVI classification.
A map layout allows you to prepare a map for presentation or export by adding elements such as a title, legend, scale bar and north arrow.
Step 1 – Open the Layout Manager
In QGIS, open:
Project → New Print Layout
Give a name to your layout (for example: NDVI_map) and click OK.
A new layout window will open.
Step 2 – Add the map
Click Add Map in the toolbar.
Draw a rectangle on the page.
The map from your QGIS project will appear in the layout.
You can adjust the extent and zoom level if needed.
Step 3 – Add a title
Click Add Label
Click on the page
Enter a title, for example:
NDVI Classification – Casablanca study area
In the Item Properties panel you can adjust:
font size
alignment
position
Step 4 – Add a legend
Click Add Legend
Click on the page
The legend will automatically display the NDVI classes.
You can edit the legend in the Item Properties panel:
rename classes if needed
remove unnecessary layers
Step 5 – Add a scale bar
Click Add Scale Bar
Click on the page
Select the map item associated with the scale bar.
You can adjust:
units (meters or kilometers)
number of segments
style
Step 6 – Add a north arrow
Click Add Picture
Click on the page
In Item Properties, select a north arrow symbol
You can resize and reposition the arrow.
Step 7 – Add author and data source
Add a small text label with information about the map:
Example:
Author: Your Name
Data: Sentinel-2 imagery (ESA Copernicus programme)
Step 8 – Export the map
Export the final map:
Layout → Export as PDF
Save the file as:
NDVI_map_layout.pdf
Example of expected map layout
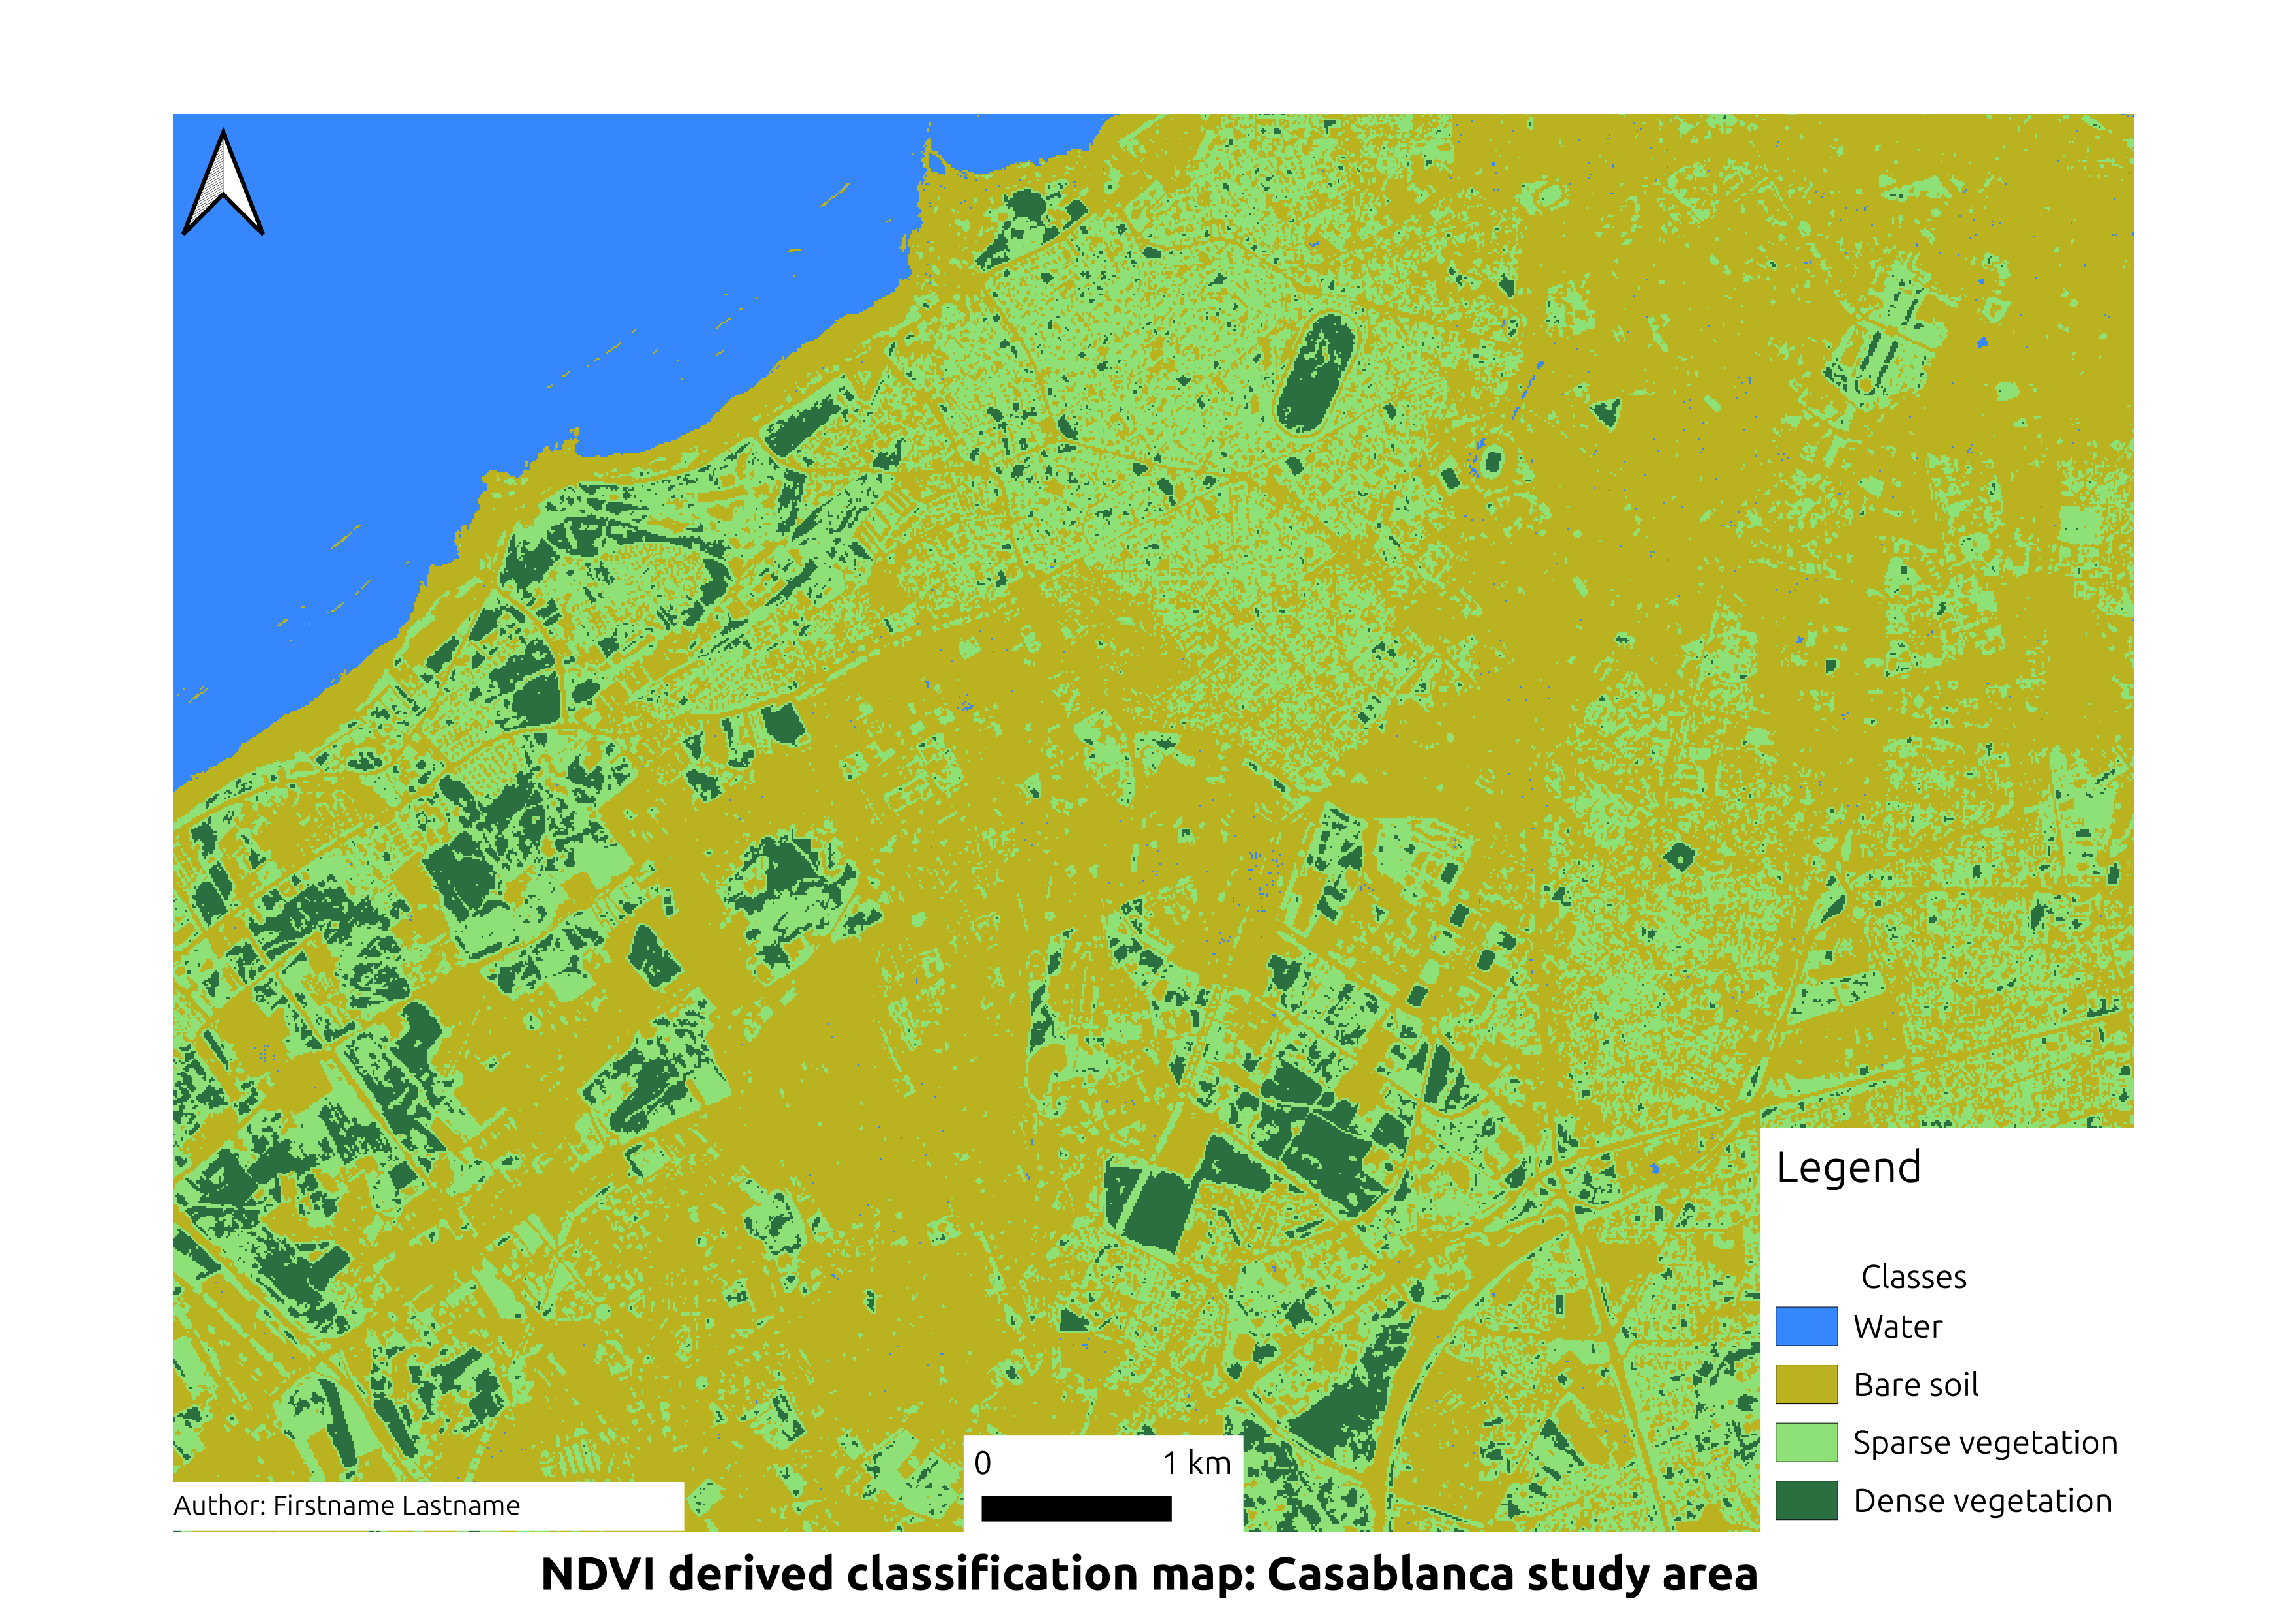
Example of a cartographic layout including title, legend, scale bar, north arrow and author information.